
From movement extracts to a method for reading work
WythinForge Intelligence FTE
A WMS movement extract can count events, but it cannot explain how capacity, time and operational flows fit together. WythinForge Intelligence FTE turns those rows into a repeatable method for reading workload, coverage and the work behind each day.
The story
A movement extract records events, not the work
The starting point looked simple: files containing WMS movements. They could say that a row existed, when it happened and which flow it belonged to, but a list of events was not yet an analysis of the work. It did not distinguish a system row from a physical movement, explain the time between activities or show whether the source was complete enough to support a decision.
Reading the extract directly risked turning volume into a misleading shortcut for effort. The useful question was not who had the highest count, but how the operation could reconstruct workload, available capacity and exceptions with evidence that people could inspect.
We built the method before the dashboard
The first product decision was methodological. Movements are classified into operational flows, related rows are reconciled and physical events are separated from technical traces. IN, OUT and FEED become comparable only after their own rules, coverage and unresolved exceptions are made explicit.
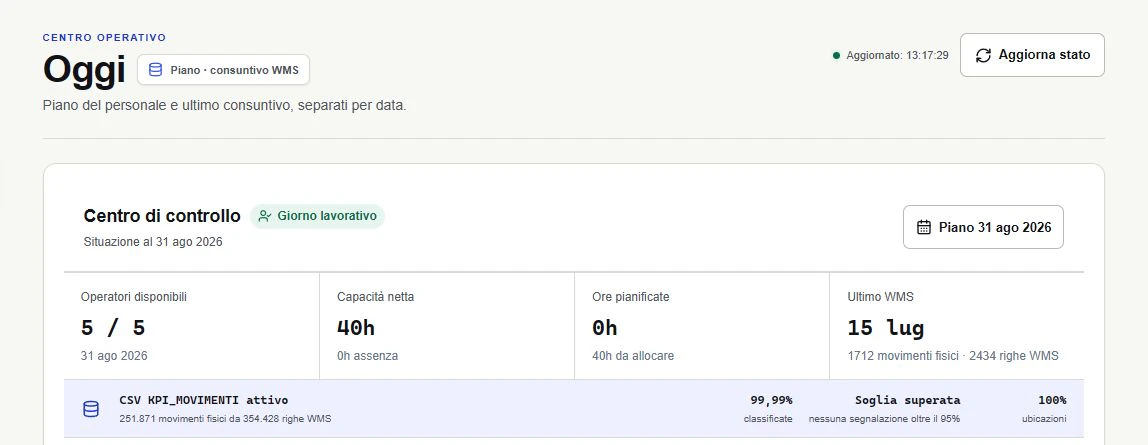
That method also measures the reliability of its source. Classification coverage, missing locations, unresolved rows and the date of the last usable extract remain visible, so a chart cannot quietly suggest more certainty than the underlying data supports.
Then we added the time the WMS cannot see
Movements describe only part of a working day. Shifts, absences, meetings, planned allocation and manual activities are added as governed context, allowing the system to separate attributed time from time that still needs an explanation and to compare the plan with what the operational evidence shows.
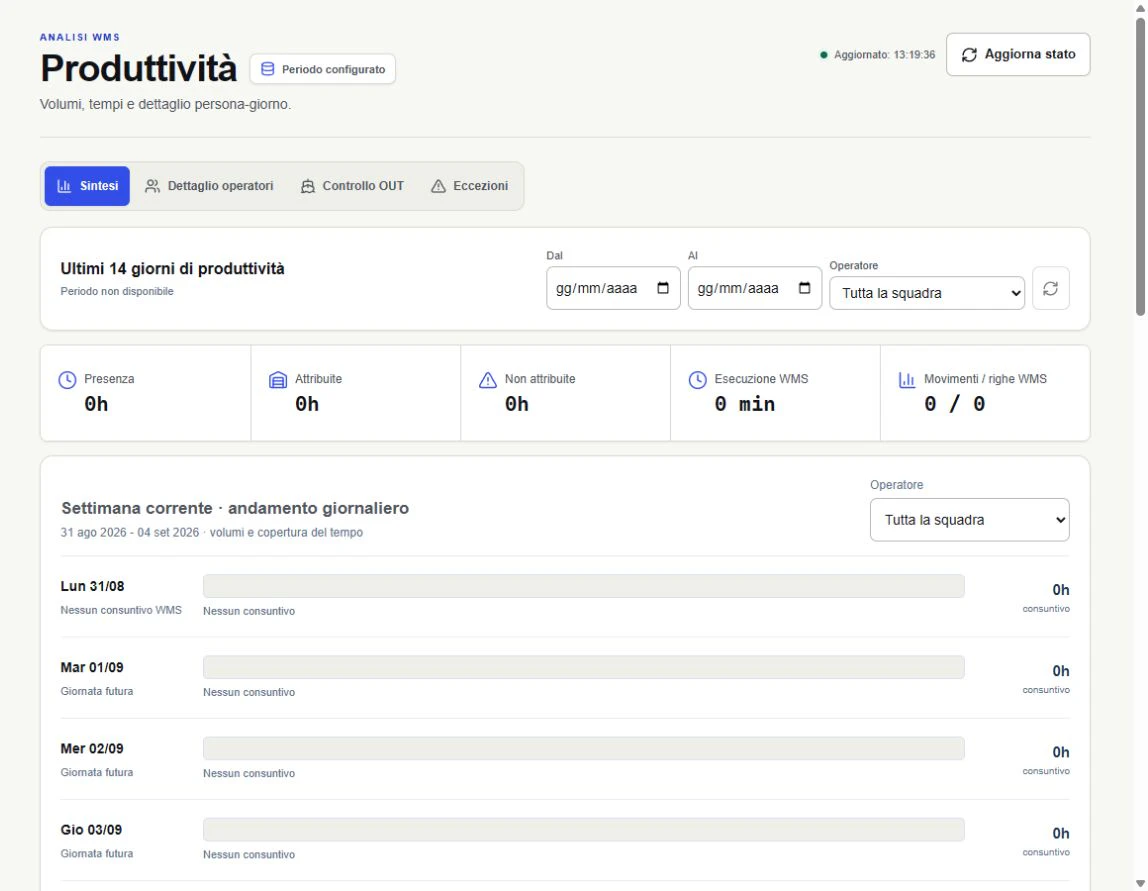
The result is a person-day timeline that can be inspected rather than a single opaque score. A team lead can move from an aggregate FTE-day or movements-per-FTE view to the underlying day, flow and exception without losing the assumptions used by the calculation.
The result is a governed reading of workload
WythinForge Intelligence FTE brings capacity, movement evidence, plan-versus-actual context and data quality into one local analytical layer. The same method can be repeated on every new extract, making trends and anomalies comparable without rebuilding the analysis in a different spreadsheet each time.
The product supports operational interpretation; it is not an automated employee-ranking system. Measures remain connected to source coverage, work context and human review so the organization can discuss workload and improve the method instead of treating a raw count as a verdict on a person.
What happens now
Movement classification method
Separate physical movements from technical rows, reconcile related events and make IN, OUT, FEED and unresolved exceptions comparable through explicit rules.
Time and capacity context
Combine shifts, absences, meetings, planned allocation and manual work to distinguish attributable evidence from time that still needs interpretation.
From team KPI to person-day evidence
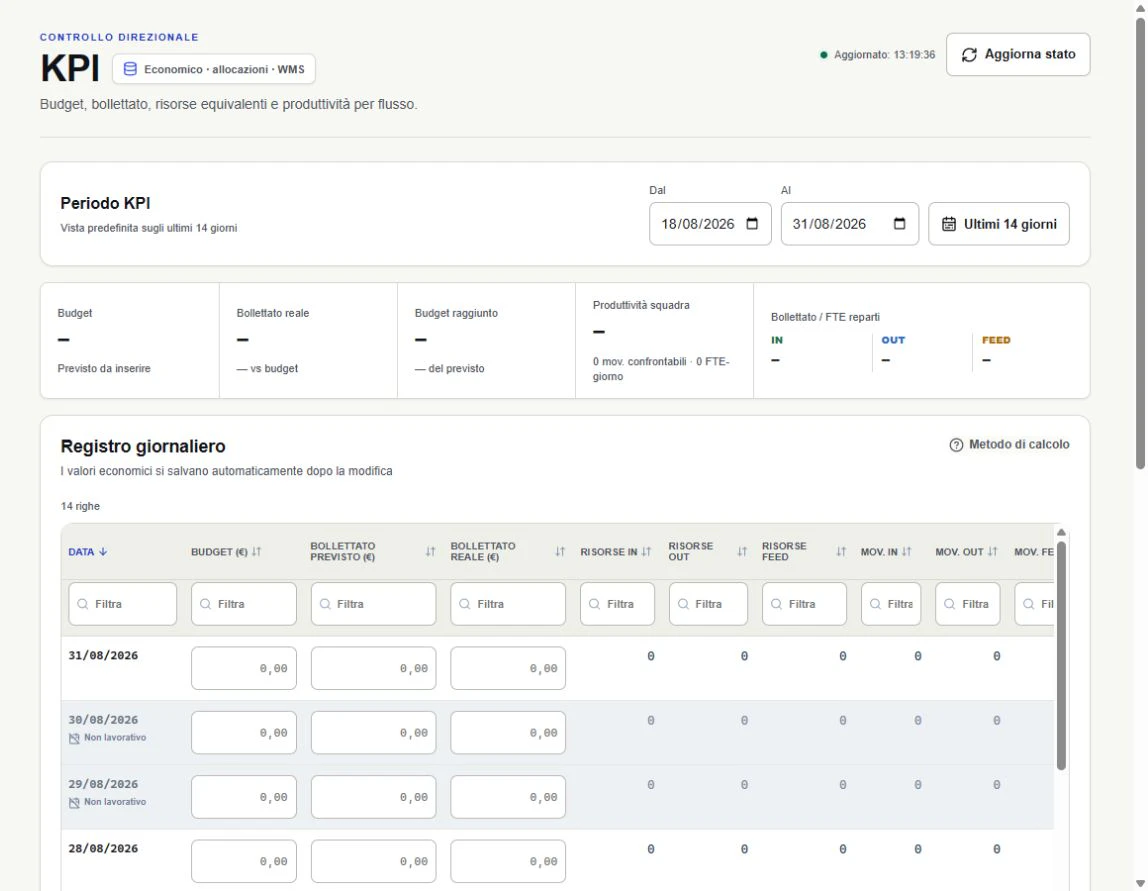
Read FTE-days and movements per FTE at team level, then inspect the day, flow, source coverage and timeline supporting the aggregate.
The essential product evidence
Only the most useful screens are shown. Product visuals use synthetic scenarios and may preserve the original Italian interface; customer outcomes remain separate from demo values.
Show me the extracts you want to turn into a repeatable method